Dimensions v. Metrics in Looker Studio
Anyone who's spent time with Looker Studio (formerly known as Data Studio) has likely encountered two primary data types: Dimension and Metric. For those of you that have more experience in data analytics, these probably seem intuitive on the surface. However, even some statistical experts may get tripped up with what Google means by each of these terms. In this guide, we’ll briefly cover the basics of each data type and highlight the differences between them. If you’ve faced issues in Looker Studio in making charts exactly as you want, this may help you solve your problems.
Data Types
Before we dive into the specifics about the dimension vs. metric conversation, it’s important to talk about what data types are in general. Whether you’re in Python, R, Tableau, or any other statistical platform or language you’ll notice there are similar distinctions. For instance, date variables are handled differently compared to variables like total revenue. You’ll also notice that if your data was not properly prepared, you’ll have your revenue numbers coming in as a “character” string, or in Looker Studio’s case, a character dimension. Understanding these different data types will help us lay the groundwork for the discussion.
Strings, Numbers, and Dates
For most people looking to analyze a data set, there will be three primary data types: Strings, Numbers, and Dates. Dates are more of a unique case, so we’ll start there. When we talk about dates, they’re generally formatted in one of a number of ways. For example, January 25th, 2023 can be written as 1/25/23, 2023-25-01, 25/1/2023, and so forth. These are treated as dates from the Unix datetime stamp. Generally, these are stored under the hood as the total time since January 1, 1970 - which is Unix time. But, the way it’s displayed doesn’t impact the actual storing of the data. Each platform will have its own default way of displaying these dates.
The reason this is important is because, when dealing with Characters (or strings) and Numbers, the way they are stored in your data set has a significant impact.. If you’ve worked with revenue data in the past, you may have come across issues where the program you’re using says it’s unable to do calculations on a string variable. Then you dig into your data and you see the revenue is stored as $1,000, for example. Well, the reason it’s not a number, is because it includes two different characters - the dollar sign ($) and a comma (,). The process to convert this into a numeric variable is beyond the scope of this article, but it’s important to be able to at least identify why this is happening.
Lastly, numbers are just as they sound, they’re numbers. This doesn’t require much beyond that, so we’ll leave this discussion here.
Dimensions in Looker Studio
Someone coming from a data analytics background may automatically assume that dimensions are string variables, and metrics are numeric variables. The names seem to suggest as much, at least. For the most part, you’d be right. But I would encourage you not to think of them this way. Rather, you need to consider if the numbers are already
aggregated or not.
Looker Studio’s own
documentation states that these dimensions are “a set of values by which you can group your data… categories of information”. That means that a character variable will always be a dimension. However, metrics can also be dimensions.
Using the same documentation as above, we see that “dimensions also include unaggregated numbers”. So this would include anything that isn’t already some calculated or aggregate measure. But what does this mean in practical terms?
In the image below, you’ll see that we have some fake data related to sales. We’re tracking the date, order number, category (online or in store), price, and discount. You’ll notice that we have two numeric variables - Price and DIscount. But what happens when we load this data set into Looker Studio?
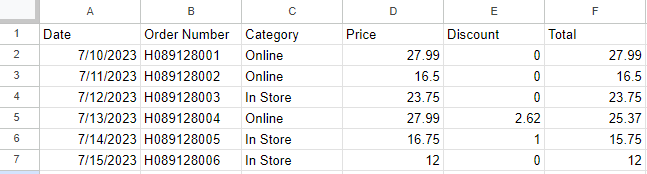
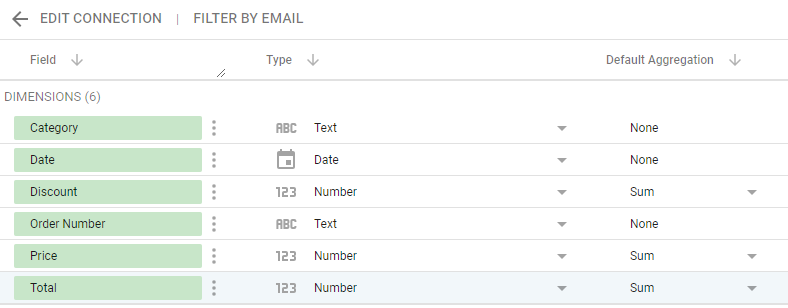
These two numeric variables
still come in as Dimensions. Why is that? It’s because those numbers are unaggregated. In other words, they are simply just another variable in your raw data set. Nothing has been done to them - they haven’t been transformed in any way - they’re just additional columns of information associated with a row in your data.
Let’s now take a look at the other side of the aisle - metrics.
Looker Studio Metrics
Metrics,
as defined by Looker Studio, are aggregated variables that itself have no pre-defined values. No pre-defined values, what does that mean? It means that the variable only gets values once the aggregation is carried out. "For the aggregation to take place, some operation must be performed on one or more of the other variables. Let’s take, for example, the average of our price variable. The average of our price variable can depend on a few other things. For example, what if we filtered so that we only had Online sales? Our new average price filter would be recalculated so that it gives us the average price after the filter has been applied. This means that the metrics in your analysis calculate
on the fly.
Why Does This Difference Matter?
This conversation may not seem super important to you, especially if you’re just starting out in Looker Studio. As you advance and start employing formulas, you'll likely encounter this error frequently.
Understanding the difference between metrics and dimensions will help you more confidently approach your Looker Studio dashboards, and find more success in creating new variables the first time.
Metrics as Separate Variables
There are two different ways you can utilize metrics within your Looker Studio Dashboard. First, you can have metrics as their own variables. This approach is preferred when you frequently reuse a number, or when the number has significant independent importance. The next way to do it is to create those metrics within formulas.
Creating it as it’s own variable makes it accessible in your data source. This can be done using the “Add a field” option under the Data tab, or you could do it directly within your data source by clicking on the “Add a field” button there.
However, if you want to only use the variable one time, it may be preferred to just create it within the formula it’s needed in.
In that case, you can just aggregate the dimension directly within the formula by using one of the default aggregators, such as AVG(), SUM(), COUNT(), etc.
In Conclusion
We’ve covered a lot here. From different date types to the specifics of dimensions and metrics and what makes each of them unique. Understanding these differences can help you avoid unnecessary obstacles when building your dashboards.
There’s a lot more that goes into making efficient and expertly crafted Looker Studio dashboards. But this will help get you started.
Enjoy your dashboarding!