Data Analysis 101: How to Interpret Your Marketing Metrics and Make Better Decisions
Introduction
Imagine running a marketing campaign without any data to guide your decisions - it would be like driving a car with a blindfold on! In today's data-driven world, understanding and interpreting marketing metrics is not only crucial but also indispensable for businesses that want to make better decisions, optimize their strategies, and drive growth. However, many businesses find it challenging to interpret the vast amounts of data generated by their marketing efforts, leading to missed opportunities and suboptimal decision-making.
With even just basic data analysis, you can turn raw numbers into actionable insights that pave the way to success. In this post, we will discuss the basic principles of data analysis and provide practical tips for interpreting your marketing metrics to make well-informed decisions that elevate your business.
The Basics of Data Analysis
Data analysis is the process of collecting, cleaning, analyzing, and visualizing data to extract valuable insights and make informed decisions. The basic principles of data analysis include:
- Data Collection: Gathering information from various sources, such as website analytics, customer surveys, and social media platforms
- Data Cleaning: Removing inconsistencies, duplicates, and errors from the collected data to ensure its accuracy and reliability
- Data Analysis: Examining the cleaned data to identify patterns, trends, and relationships that can inform decision making
- Data Visualization: Presenting the analyzed data in a visual format, such as charts and graphs, to quickly and easily understand what's going on and what decisions should be discussed
Covering the buzz-words is important, but these ideas are too abstract if not applied to an example. To see how basic data analysis can help you identify problems within your business, let's take a look at a fictional fashion retailer, StyleSavvy.
StyleSavvy was struggling to understand why their website's conversion rate had been declining over the past few months. They've made a few changes to their website including a new layout, a chat-bot, and a change in their pricing structure to put more of the pricing on shipping costs to entice people to add-to-cart with a lower listed price. They weren't sure what was contributing to this drop off in conversion rate, so they set out to take a look at their website data armed with one question: "Where in the journey are their website visitors falling off?" After collecting and cleaning their website data, they analyzed user behavior and discovered that their add-to-cart rate actually hadn't changed much. It appears their change in pricing structure and new layout didn't impact the add-to-cart user behavior. However, a high percentage of visitors were abandoning their shopping carts at the checkout stage. By taking even a quick look into their data, and starting with a clear question, the owner of StyleSavvy was able to quickly see that customers were deterred by high shipping costs. As a result, they tested offering free shipping on orders over a certain threshold, which led to a significant increase in their conversion rate.
This simple example is probably intuitive to those seasoned in business, or even just purchasing on eCommerce websites. However, stick with me and we'll dive deeper into the process you should be taking to better analyze and interpret your marketing metrics.
Concise Dashboards: Who Are We and Why Should You Keep Reading?
Howdy, I'm Dan. Owner here at Concise Dashboards. I just wanted to jump in here real quick to tell you a little bit about what we do. If you're not interested, feel free to skip this section (it'll only hurt my pride).
We are a dedicated team of analytics experts who have worked across a number of industries, and all business sizes. From local pet stores, to Amazon advertising agencies, and even Silicon Valley startups. As a full-service analytics company, we set up your data pipeline (fancy word for how you get your data out of platforms and into your hands), automated reporting, user-friendly dashboards, and custom analyses for those of you that are looking to get even deeper into your data.
Want to see what we would do for your business? Click the link below to schedule a free data audit and see how you could be better using your data to increase profits, improve retention, and feel more confident in your decision making.
How to Interpret Your Marketing Metrics
To make the most out of your marketing data, it's essential to know how to actually interpret your metrics. All of the data in the world is useless if you don't know what to do with it. Honestly, it's probably worse than that. Without knowing what to do with your data, you could be making ill-informed decisions that you think the data support. But don't worry, getting started with data analysis isn't as scary as all the jargon you'll see about it make it seem. Let's dive into the basics and see if we can help you get a better understanding.
Define and Track Key Performance Indicators (KPIs)
When beginning your data analysis journey, it's easy to get overwhelmed with all of the data at your finger tips. Take a step back and shift your frame of mind. Rather than looking at your data and saying "look at all this cool stuff I can do!", say "what important business questions do I need to answer right now?"
In this step, don't even consider if the data you would need to answer the question are available. Right now, just focus on listing out one or two questions.
For example, common starting places for many small businesses would be to look at:
- How many people are coming to my website and actually signing up, filling out a form, or purchasing?
- We're thinking about re-structuring our pricing to be more in-line with our competitors, what are our actual customer acquisition costs?
- We're struggling to get returning purchasers to the site, is there a way we could increase our average order value of that first purchase?
Starting from a framework of questions like this, you'll be able to find overlap. This overlap in your questions will begin to help you better figure out what question you listed is the most important, and may even help you create a new question that feeds into all of this.
Analyze Customer Behavior
With your questions now figured out, we can go on to the next step: analyzing customer behavior. For most businesses, this can be as simple as setting up Google Analytics properly on your site to make sure that you can understand the behavior of your website visitors. If you're getting traffic to your site, there is a mountain of information your visitors are sharing with you. If you're not tracking this properly, you're missing out on valuable insights about what your website visitors are looking for, and if you're meeting their expectations when they visit.
If you're active on social media, running ads, nurturing via an email newsletter, there is even more information for you to go through. This is where it's easy to get lost in your data. But don't forget what we said at the beginning of this, by keeping it simple we can begin to get insights. We don't need all the information right away. So all we'll do right now is consider the various customer persona's we want to target. We'll file this away for now and circle back to it later when we get into segmenting your data.
FoodieHeaven: A Case Study
I always find that this information is much more useful when used in an example. So let's take a look at another fictional case study, we'll call this business FoodieHeaven. FoodieHeaven is a restaurant looking to improve it's social media engagement and drive more customers to their online reservation system. They've been at it for a few months now, but haven't noticed any significant uptick in the number of online orders. So, they turn to the data to see if it can offer any additional insight.
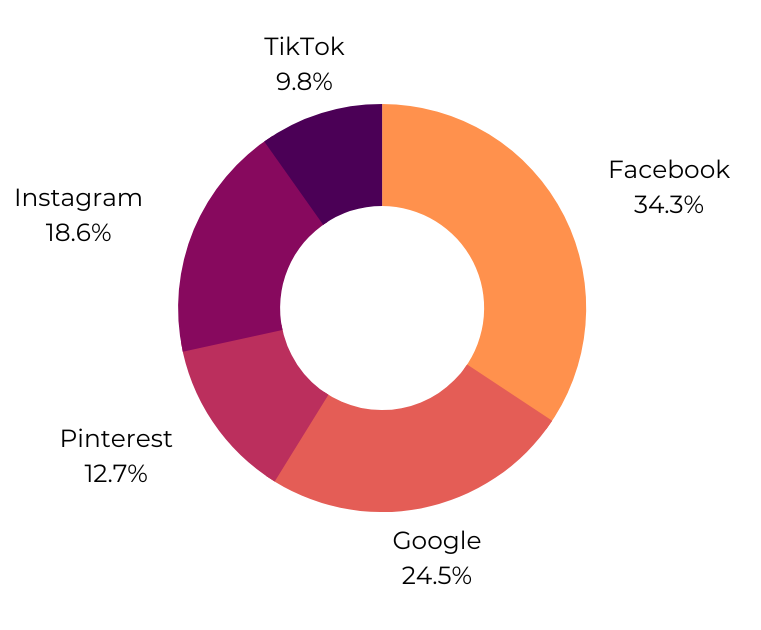
Analyzing the information on their social media platforms, FoodieHeaven found that their posts with high-quality images of their signature dishes received the most engagement. Even better, reposting of images that were shared from diners did the best. Taking a deeper look, they found that the time they posted significantly impacted the number of clicks to their online reservation system. Posts that were shared during lunch time lead to nearly twice as many bookings as those shared at other points throughout the day. Armed with these insights, FoodieHeaven now has a clear direction for their social media content: post high quality images during lunch time, and watch those reservations flow in.
FoodieHeaven wouldn't want to stop there though. After doing this exercise one time, they would be wise to continue monitoring this information to see if there are any changes in behavior, or if there are any deeper insights they could gain from properly testing and tracking different approaches.
Identify Trends and Patterns
Now that we've thought through the questions that matter for our business, identified our KPI's, and made sure that we're collecting data smartly, we can use this information to go a step or two further. The first step we can take is by looking for trends and patterns within our data, and within our industry.
Sometimes, the data you collect can only tell you so much. If you're in a smaller market, or a relatively new business, you may not feel confident that your data is giving you an accurate picture of what's going on. A great way to overcome this is to look for other businesses in your industry and track their methods. This could be done by checking out their websites, their social media, and even subscribing to their newsletters to see what they're saying - and most importantly when they're saying it.
To help illustrate this point, let's consider a seasonal service-based business like power washing. You've been in business for a few years, and you always find that there is a huge increase in the number of visitors to your website and appointments starting around March. Then, it dies off around Halloween, and repeats again next year. This cycle is important to know, and is something you likely won't need robust data to figure out. However, you're noticing that your clientele is rather flat, and you don't have any confidence in the number of appointments you'll get in the next March. So, you decide to follow the content that a few very successful power washing companies a few states away are posting and you find out they have an early-booking incentive program they start immediately in November to book them out for the next year. Interesting, right?
By looking not only at your trends, but the trends of the businesses around you, you'll be able to get a lot of what we call "unstructured" data. In this sense, your unstructured data wouldn't necessarily be numbers on a spreadsheet. Rather, it would be knowledge that you're gaining from following these other companies and using their experience to move your business forward.
Segment Your Data
This section is a little bit more advanced, but it is something you should start doing as early as possible. But what does it mean? Segmenting your data is simply breaking your data down into smaller groups based on factors like demographics, behavior, or geography. Luckily, it's pretty easy to do this within a variety of tools, whether it's Google Analytics 4, or an email marketing system like MailChimp or Klaviyo.
This serves two purposes for your business: Targeting, and Better Analysis. We'll cover the targeting in an example below, so here I want to focus on what I mean by "Better Analysis." If you think about your data with segmentation in mind, you'll quickly be able to think about your business in a much different way. Rather than a large sea of potential clients or customers, you have a lot of little ponds that you can go fishing in. Some ponds are better than others, either with simply more fish, or better fish that are maybe a little harder to come by. Getting an early understanding of this within your business can help you be a lot more effective early.
Looking at the targeting side, segmentation is often discussed in the context of email campaigns. Let's again use a fictional company, MailMasters, to discuss how segmenting could be used to improve their clients open and click-through rates.
Case Study: Segmenting to Improve Email Campaign Performance
MailMasters set out with a simple goal in mind - improve open and click-through rates of the email campaigns they run. When they got started with this, they couldn't figure out a rhyme or reason that some campaigns performed better than others. They realized one big problem: they were treating all email subscribers the same, no matter what.
Solving this problem was relatively easy for them because they had a set of data about the purchasing behavior, and acquisition channel (ex. the ad they came from or if they found them on social media) for each of the emails. With this information in hand, they're able to better craft specific messaging to that particular group.
For example, if someone became an email subscriber because of an ad campaign that focused around baseball, it could be useful to use that information within an email campaign since they likely have an interest in baseball. Meanwhile, if they came in through Instagram, maybe they loved the visual aspect of the work that was being done, and it would be better to tailor the messaging around that. Hopefully with this simple example, it's clear to see how segmenting your data to create insights, and tailor messaging can lead to improvements within your business.
Test and Optimize
We mentioned this earlier when talking about FoodieHeaven's analysis of their social media, but the idea rings true for everything about your marketing efforts within your business. Proper testing is the key to figuring out what messaging works, and what maybe falls a little flat. Commonly, people start by testing and optimizing different ad copy, landing page designs, calls to action, and email subject lines. We recommend this as a great starting point. The important part here is the "proper" part of the testing. Blindly testing is effectively throwing money down the drain because you aren't able to pull out any valuable information from your tests.
What do we mean by this? I'm glad you asked. We used a few examples above, but let's just focus on one: landing page design. If you're running ads and you want to see if you can improve their performance by changing up the landing page or call to action, here's the approach we would take. Change one thing for each test. That is, if you're changing the landing page design, do one thing - for example change the header image from a group photo to a photo highlighting the product. That's one test. Run that and see how it performs. Then, once you see a winner, change the button color from it's usual color of blue to green. Run that test, and see how it performs. Are you starting to see a pattern here?
By changing one thing when you're getting started with this, and running simple testing, you'll be able to actually compare the performance of each to each other, because the only thing that changed was the one change you made. If everything else remains equal, it could be suggestive that the difference in the performance is due to the one thing you changed.
Putting it All Together
Navigating the world of data analysis can be challenging at first. There are a lot of new words, a lot of flashbacks to a statistics course you may or may not have taken, and a lot of people steering you in complicated directions that make you think that an "all or nothing" approach is required. By starting out with some basics, and laying the foundation to go along with that, you'll be well-equipped to begin unlocking the hidden potential within your marketing efforts.
Bonus Insight
We took the goal setting for granted here, and laid out only some basic objectives at the beginning of this. To make the most out of your dive into data-driven decision making, you'll want to be setting specific, measurable, achievable, relevant, and time-bound (SMART) goals. By doing this, you can better align your marketing strategies with your business objectives, track your progress, and evaluate the success of your campaigns.
Make sure that each of your goals are clear, quantifiable, realistic, and connected to the overall vision for your business. By setting a time-frame for these goals, you'll make sure that it doesn't get lost in the shuffle of things to do as a business owner. If you take one thing away from this long article, let it be this - data analysis is not a one time task, but an ongoing process that helps you stay ahead of the curve and make well-informed decisions.