The Role of Analytics in Data-Driven Marketing: How to Make Better Business Decisions
In today's digital age, businesses have access to an unprecedented amount of data about their customers, their marketing campaigns, and their overall business operations. Everywhere you look, you’re constantly told how data is everywhere, and if you’re not using it in your business… well, they’re sorry to say - you’re just not doing business right.
But that’s the difficulty that everyone seems to gloss over. Making sense of this data and using it to make informed business decisions can be a challenge. What data should you collect? How should you analyze it? Are you violating privacy laws? Is it “this data” or “these data”? The list of questions only seems to grow the more you learn.
But, before we can get into the nitty gritty, we have to set a foundation for what we’ll be talking about throughout this. So, let’s start with the big one: “Analytics.” Analytics is the process of collecting, analyzing, and interpreting data to gain insights and make better decisions. I’ll refer to this entire process as your analytics system. It’s not just the dashboards and reports, it’s everything from raw data collection, through automated emails that tell you your numbers from the day before.
In this blog post, we will explore the role of analytics in data-driven marketing and provide practical tips for businesses on how to make better business decisions using analytics.
Assessing Your Analytics Needs
This is a crucial step that is overlooked far too often. The conversation in your head becomes “well, I might as well get as much data as I can, right?” For the sake of a small business, I’m going to stand my ground and say that’s just flat out wrong.
You might be wondering why I would take
such a strong stance on that. It’s because I’ve seen what happens when businesses take that approach. They’re tracking every little click on their website (even for things that don’t matter), the shirt they were wearing on the day they closed 5 new deals, and everything in between. The truth of the matter is, collecting too much data can lead to two major negatives:
- Overwhelm. Let’s be honest. If you’re looking at dozens and dozens of spreadsheets, it’s hard to keep track of what’s happening, let alone draw conclusions from that data.
- Incorrect Conclusions. With too much data, there’s a chance you’ll create spurious (think bogus) connections between your data that may cause you to shift your focus to channels that aren’t as successful as you think. “Muh data” I can hear echoing in the minds of some right now. Start with a little trust in me, and if you take this journey, you’ll be better off for it.
With that out of the way, we can talk about how we can actually assess your analytics needs. This is actually quite straightforward to do. For most businesses, there are really a few things that are necessary to track as early as possible.
To figure this out for your business, convene a council of the best business minds you know (your dog definitely counts) and just start talking about your overall goals. Do you have a growth rate target you want to hit? I personally, would opt for a question of - “How much did we make last year, and what number will we be disappointed if we don’t make this year?” The data you collect should be relevant to every question that you find yourself asking. Pay particular attention to the ones that keep you up at night.
Choosing the Right Analytics Tools
Once you have an idea of the questions you want to answer, we can now begin figuring out how we might start tracking data that can help us figure out the answers to our questions.
The biggest one to mention right from the start is
Google Analytics 4. GA4 is the new and “improved” version of analytics tracking provided by Google. If you’re like most people and prefer Universal Analytics, just make the switch. I put “improved” in quotes for a reason, but UA will be going offline in July of 2023. The longer you wait, the less data you’ll have when it’s all you can rely on for website data.
Now, tracking your website data can either be really important, or something that doesn’t matter a whole lot to your business. For an eCommerce store, your website data is pretty much everything. For a local service provider, it can be useful, but don’t spend weeks trying to get everything just right. Set it up, get a few custom events, and then make adjustments as they become necessary. Or, you can reach out to us about our Local Service GA4 set up and we’ll get it all squared away for you.
Other than that, the next step for most will just be trying to figure out how to get their data out of various platforms and into
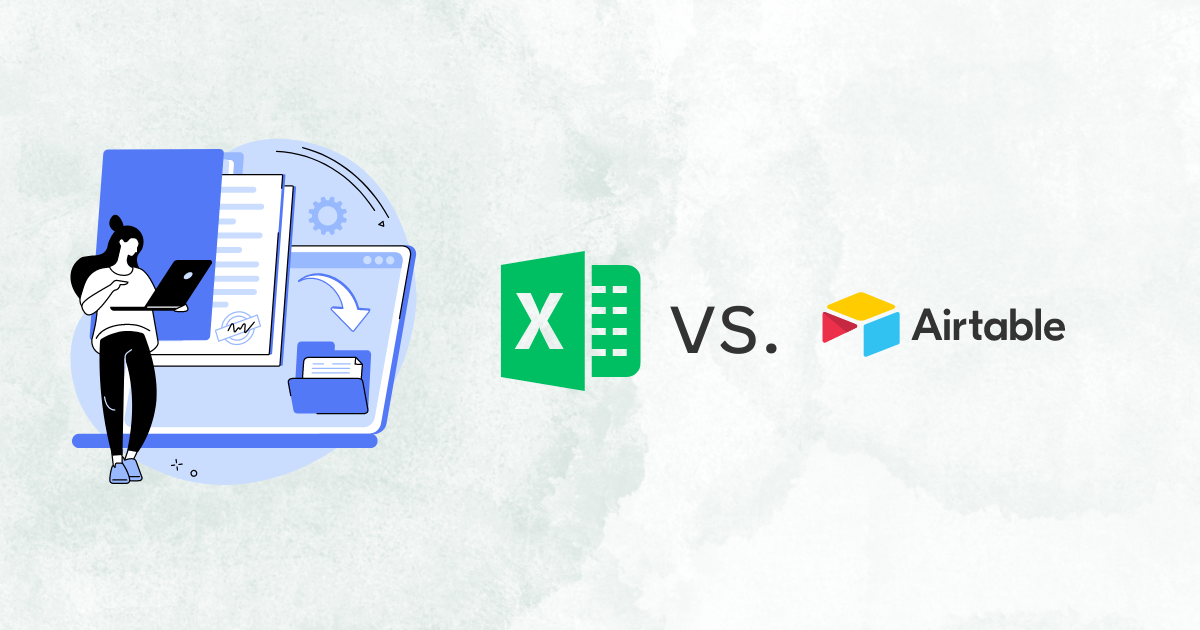
a system that they can manage. For example, for Facebook, Instagram, and whatever email system you use. Each of those platforms already track data and provide you with some level of a dashboard. You may be thinking - okay, I just need to figure out how to better use the reporting within the system. Maybe. But most likely, what you should be doing is trying to get the data out and stored in your own database, Airtable base, or even the dreaded Excel spreadsheet or Google Sheets.
You can choose a number of Connectors, as they’re called, to try to get your data out and stored in your own system. These are just tools that companies have built to interact with the API of each platform. Rather than having to do the programming yourself, they do it for you and give you your data in a readable way. The one you choose will depend on a few things, mainly what they offer connections to and how much they cost per month. The details of this step will be reserved for another post in the future. Just keep this in mind as you’re thinking through your goals.
Setting Up Analytics Tools Correctly
Now that you have some idea of the numbers you want to be tracking, and some of the data sources you’ll be using, we need to dive one level deeper. In each of these tools, there’s a right way to set things up to get the most out of your data.
You may be thinking that I’ll tell you the best way to use the CSS selector to track button clicks in Google Tag Manager for GA4. Well… you’d be wrong. While that can be important, that’s way too far into the details to be valuable for most people just starting to take a deeper look into their analytics. As I said before, let’s start with some of the basics to lay a proper foundation. After we have that, then we can move into the more intermediate and advanced techniques to get the most out of your data.
So if not that, then what? Reasonable question. I want to highlight two things: the naming convention you use, and how to make adjustments and tests.
For naming convention, this is something that can easily be overlooked. We want names to be descriptive, yet not too detailed to where it’s 200 characters. Let’s take a Facebook Ad structure as an example. This will touch on the naming convention, but also the general structure that might make sense to set this up. I’m a data guy, not an ad guy, so don’t come at me for this illustrative example.
For this example, let’s just set up one specific goal for our campaign. Let’s say this goal is website clicks. So we’ll call our campaign something like “Campaign - Website Clicks - 001”. This will allow us to have room to make other campaigns (by changing out website clicks in the title) and also add more campaigns with the same goal, by changing the number to 002. Don’t forget, this is just one way of doing this.
Next, we go down into our ad group. In this ad group, we want to be using a specific type of ad. For example, carousel ads. Then, we can have another ad group that is using all video ads. We would name these “Ad Group - Carousel - 001” and “Ad Group - Video - 001”, respectively. You an see how we could easily add more detail if we had additional parameters that made these ad groups unique.
Finally, we go into the ads itself. Let’s say we have two ads inside of our carousel ad group. The first one uses bright colored pictures, the next one uses the exact same pictures, but with dark colors instead. We could name these “Ad - Dark Images - 001” and “Ad - Light Images - 001.”
Now, if we wanted to compare the data between our ads, we would have a few pieces of information we could use.
From our naming convention, we can easily understand what each ad, ad group, and campaign are because we descriptively named them. You may be thinking, “I just set them up, I won’t forget what they are!”
Trust me, you will. Even if its only a few days from now, let alone a few months, you won’t remember and you’ll need to take some extra time to click into the specific ad or campaign to see the details.
But more importantly, in setting up the naming convention, I was also setting the stage for what everything was going to hold. All ad groups within the campaign used the same goal, and all ads within each ad group used the same ad type. This makes our life a lot easier when we go to compare results and see what’s working, and what’s not.

Take, for example, if we set up our ads differently. Recall that the only thing that changed was the shading of the image - bright and dark. If we instead used different images inside of the ads and changed the darkness, we wouldn’t know if it was the images themselves or the shade over the images that was more or less successful. Same thing goes for the text. If we had changed the text on one of the ads, we would now be making our life a lot more difficult when it comes to analyzing the performance of these ads.
That takes us into the next point, analyzing our data. But before we get there, I want to give a bonus tip here for how to best store the data you are storing yourself in
some sort of spreadsheet.
In analyzing the data in the spreadsheet, it may make sense to put the different values (such as dates) as columns across the top of the spreadsheet. Then, you’d fill in the values in each cell. While it might make it easier to see in the spreadsheet, it basically makes your data unusable from an analysis perspective without first needing to “pivot” the data. You don’t want to be analyzing your data in Excel, so store it in a way that can be usable by more robust tools.
For the curious reader, the format I just described is “Wide” data, and should be avoided in almost all cases you’ll come across. What we want is “Long” data, which stores values at the intersection of a row and a column, and uses columns to categorize information (such as date).
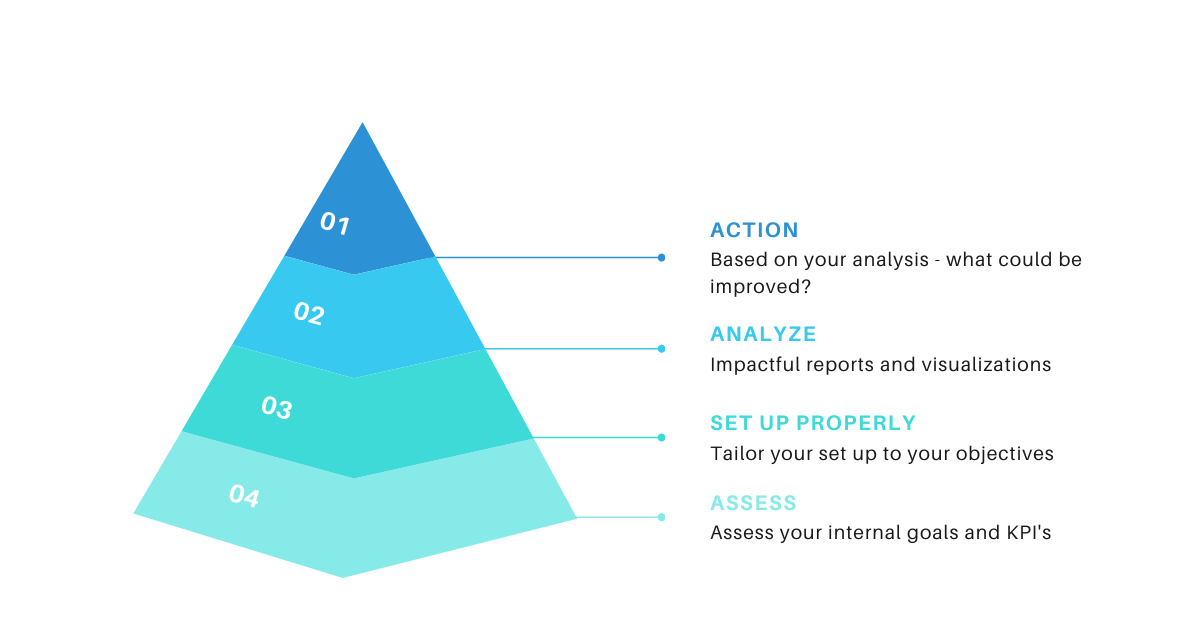
Analyzing the Right Data
Asking the right questions, laying out the data we collect, and properly setting up our data systems to feed us with usable data has finally brought us to this point. Analysis.
I’m not sure why, but the word analysis seems to carry some fear along with it. If I told you to analyze your data, you may be intimidated and not sure that you could do it at a super high level. That may be true, you may not know how to run machine learning algorithms or neural networks, but the world is lying to you by saying that you need all of that within your business.
Remember the theme of everything I’ve talked about throughout this article, keep it simple and do the basics.
Rather than diving down the rabbit hole of predictive modeling, causal inference, and other big words that may make you feel overwhelmed, let’s use some
really simple examples.
Let’s go back to our ad example from before. Because we set everything up properly, we’ve done 95% of the work. Analysis can be as simple as looking at the cost per click between the two ads we created, and seeing which one provided us with website clicks for a lower amount per click. Taking that one step further, we may be able to compare the behavior of users that came from each ad, depending on how we set up our website tracking.
Maybe the light colored ad was giving us clicks for, say $3. Not bad, you think as you look at it. Then you take a look at the dark colored ad and each click was only $1.
You might stop there and think to yourself “I can’t turn that light colored ad off fast enough.” But then you look at user behavior and find that none of the people from your dark colored ad gave you their email to download your free thing. Meanwhile, 10 people from the light colored ad did.

The goal of your ad was to get website clicks. But diving deeper into the data shows that even though the light colored ad clicks were more expensive, they were seemingly much higher-quality clicks.
Look at that, with only a few moments, we were able to do some basic analysis that led us to making a data-driven decision within our business. Because we set everything up correctly, the analysis portion was a breeze.
Now, obviously, analysis can get much more complicated. Even in our simple example, I’m sure there are dozens of ways that we could complicate the analysis to suggest that we weren’t looking deeply enough at our data. But remember, getting started with understanding the actions you’re taking, why you’re taking them, and how they help you better measure your objectives is the goal of using a data-driven approach to begin with.
You don’t need a Ph.D. to crunch the numbers on your business.
Conclusion
We covered a lot here, and if you’ve made it this far - kudos to you. You should now be on a much better path to understanding how to utilize a data-driven approach in your business. And as an added bonus for you that have made it this far, I want to share a piece of wisdom I learned when I was in graduate school.
As an economist, we would constantly talk about the “economic way of thinking.” It was a framework that helped you approach problems from a particular angle. Data analysis, and being more data-driven within your business is the same thing. It’s a mindset. It can surely be challenging, but once you start utilizing a data-driven mindset, the details of how to do it will begin to fall into place. And hopefully at the end of it, you can have a greater understanding of your business and grow to help more people with the services or product you offer.