Unleash the Power of Data-Driven Decisions for Your Small Business
Is your small business leveraging the full potential of analytics to make informed decisions and drive growth? With the right approach, harnessing data can unlock valuable insights, optimize operations, and boost customer satisfaction. In this article, we'll reveal common analytics mistakes small businesses make and offer practical solutions to help you sidestep these pitfalls and elevate your business.
Mistake 1: Drowning in a Sea of Data
It may seem counterintuitive at first, but more is not always better when it comes to data. Collecting too much data can lead to information overload, making it challenging to uncover meaningful insights. Let's consider an example:
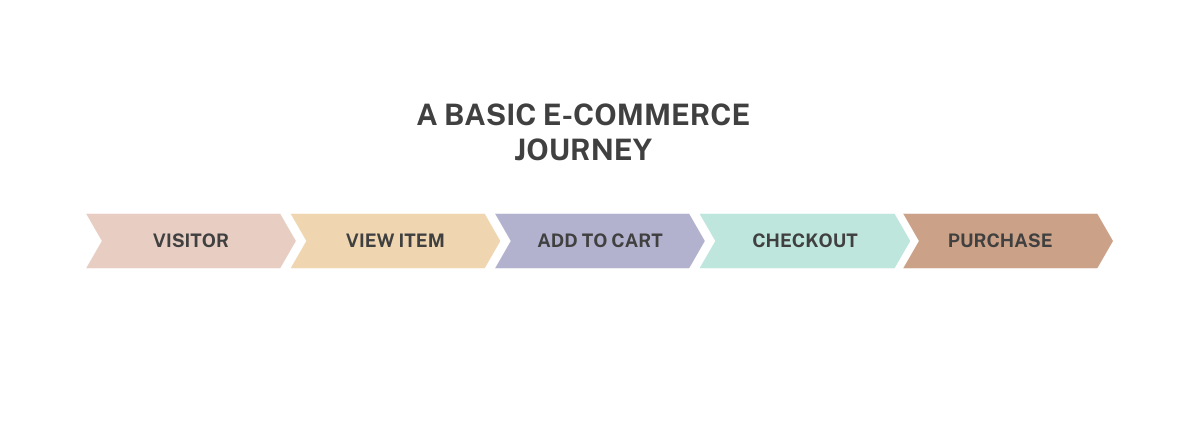
an e-commerce company is experiencing a decline in sales. The obvious approach might be to track broad metrics such as overall website traffic, hoping that an increase in visitors would eventually result in higher sales.
However, this approach might not reveal the root cause of the problem. Instead, the e-commerce company should focus on gathering more targeted data that truly matters. By prioritizing metrics like conversion rates, cart abandonment rates, and average order value, the company can gain a deeper understanding of where customers might be dropping off in the sales funnel and identify areas for improvement. Website visitors will still matter, of course, but focusing your efforts on collecting data that is not directly related to the objective will leave you feeling like you don't know where to start.
For instance, if we're starting from the point of a low conversion rate, we have a few things we may want to consider. First, it may mean that the user experience as a whole needs to be optimized. This could be discovered by looking at a handful of metrics, from engagement rate, to session duration, to the percentage of returning viewers. Alternatively, if we find that we have a low purchase conversion rate, it may be that there are some issues in the checkout process that is causing visitors to stop before they've finished their purchase. For this, it would be wise to go through the checkout process yourself and see if there is anything that causes a bottleneck for you. Maybe there's higher-than-expected shipping costs, or maybe the appearance during checkout makes the site seem less trustworthy. Maybe it's as simple as slow loading times. Often, as we can see from that description above, the "data" you collect by going through the experience yourself can help you find a good starting point for your analysis.
Taking the time to set a clear objective for your analysis will help make sure you're not only not drowning in your data, but that you're also setting yourself up to reach the correct conclusions based on that data. Being specific can lead to more effective data analysis, and ultimately provide you with a better understanding of the path forward. By honing on in the most relevant data points, you and your business can confidently tackle challenges and make more informed decisions.
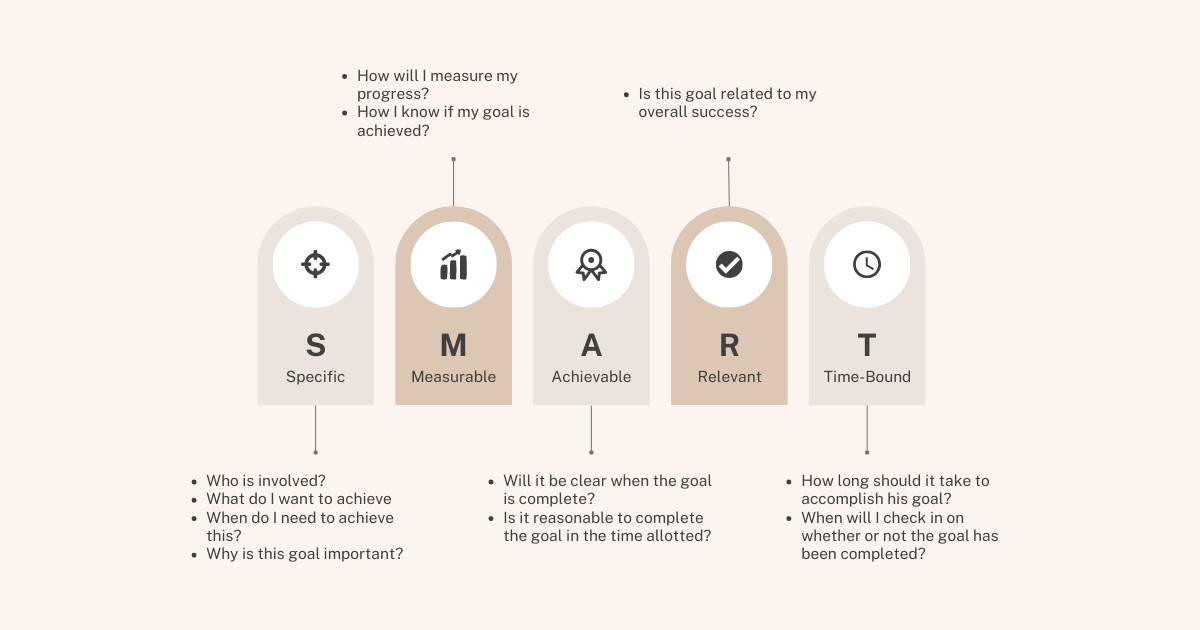
Mistake 2: Setting Sail Without a Compass
Embarking on your analytics journey without clear goals can leave you adrift. Establish specific, measurable, and time-bound objectives to guide your data collection and interpretation. For example, let's say we start with an overall goal of increasing monthly revenue by 10% within the next quarter. That's a good starting point, but we can break that down into more manageable and informative KPI's that will help us understand why we are or are not hitting that target as we progress toward our deadline.
Let's go through some of the first steps of this process for a landscaping company. With our goal in hand of increasing monthly revenue by 10% over the next quarter, we will want to track additional metrics that complement, or tell the story behind the story of our revenue data.
Breaking Objectives Down into Smaller KPI's
Here, we'll dive into a few objectives that should be tracked alongside the revenue goal. The percentages are just an example. For your company, you will want to get solid numbers for how much you would need to increase each component to individually increase your revenue by 10% - if that was the only thing to change. By setting those targets high, and assuming that only this one measurement will improve as desired, you may find yourself in a much better situation when evaluating your main objective.
Boost the Number of New Clients by 15% - Track the effectiveness of your marketing efforts by monitoring metrics such as the number of leads generated, conversion rates, and cost per lead on all of your marketing channels. This will help you understand which channels are most effective in generating you new leads, and will also give you more insight into which ones lead to more rapid conversions. Alongside this, you should also track your own performance as it relates to your marketing data. What is the average time from lead (form fill out, or click to call) to you contacting them? What are the types of leads you're getting from each platform? Are some better than others? All of these things matter and will help you get a better understanding of the client acquisition engine that can help you cement a new baseline for monthly revenue, 10% above what you are previously doing.
Increase Customer Retention by 10% - Measure your client satisfaction through targeted surveys for your own internal use. Alongside this, send out request for online reviews. This will help your presence on social media and search platforms, and will help others that find your business feel more confident about reaching out. In analyzing your survey results and online reviews, are their any common trends that you can find? Are there certain things that clients appear to be dissatisfied with, or wish could've gone better? When creating your surveys, make sure you ask targeted questions. You want to be able to drive action based on their responses, so don't leave too much to open responses (though those can be incredibly useful as an "anything else?" type of question at the end of the survey.
Expanding Service Offerings or Upselling Existing Clients - If you offer multiple, complementary services, make sure you're tracking the amount of repeat sales, cross-sells, and upsells that your clients or customers are purchasing. If you're tracking these numbers, it will be much easier to take a quick look into the data and identify services that clients/customers think pair well together. This can help you create new packages, that offer those services or products in a bundle, and potentially increase the average order value of your clients or customers.
Improving Operational Efficiency by 10% - Monitor the time spent on each project, labor costs, and the utilization of resources. It's almost a guarantee that you can find ways to streamline your business that can help you either be more efficient in the fulfillment of your services, or reduce costs to improve your profit margin or reinvest in other parts of your business.
By setting smaller, more focused objectives and tracking the associated KPI's, you'll have a much better picture of your progress toward your overall objective and what parts of your business may need some extra care in your journey toward your goal. At the end of the quarter, in our example, you can evaluate your performance in each area to see what worked and what didn't and adjust your strategies accordingly. This will not only help you understand if you hit your goal and why, but it will also give you additional ideas that will keep you continuously improving your business and driving growth.
There are obviously dozens of smaller objectives we can break each of the bolded goals above into. This is just the starting point. I would suggest that you try to continue to break down your goals, and what data you would need to make sure the goals are able to be properly measured and tracked. Even if you don't know what data you would need, write down what you think it would be and don't worry too much about the details of tracking each at this stage. You'll get there, and mapping it out to get you thinking in a data driven way will be helpful in your long-term goal of creating a data-driven business.
Get a Free Consultation to Help You Identify Key Objectives and KPI's
Free Consultation
Mistake 3: Navigating with an Outdated Map
Outdated or unreliable data can send you off course, leading to costly mistakes. With the world evolving seemingly more rapidly than ever, it can be challenging to keep up with shifting consumer preferences. However, imagine, as a restaurant owner, you introduce a new menu item based on old customer preferences, only to find that it fails to resonate with your patrons. You may be left feeling disappointed and wondering what went wrong. You might even be tempted to double down on promotions or advertising to boost sales, but that may not address the root cause of the problem.
While it can be hard to keep up with the trends, by setting up things that we've already talked about above in the article (for example surveys of customer feedback), you'll be able to see how your target audience may be shifting their desires.
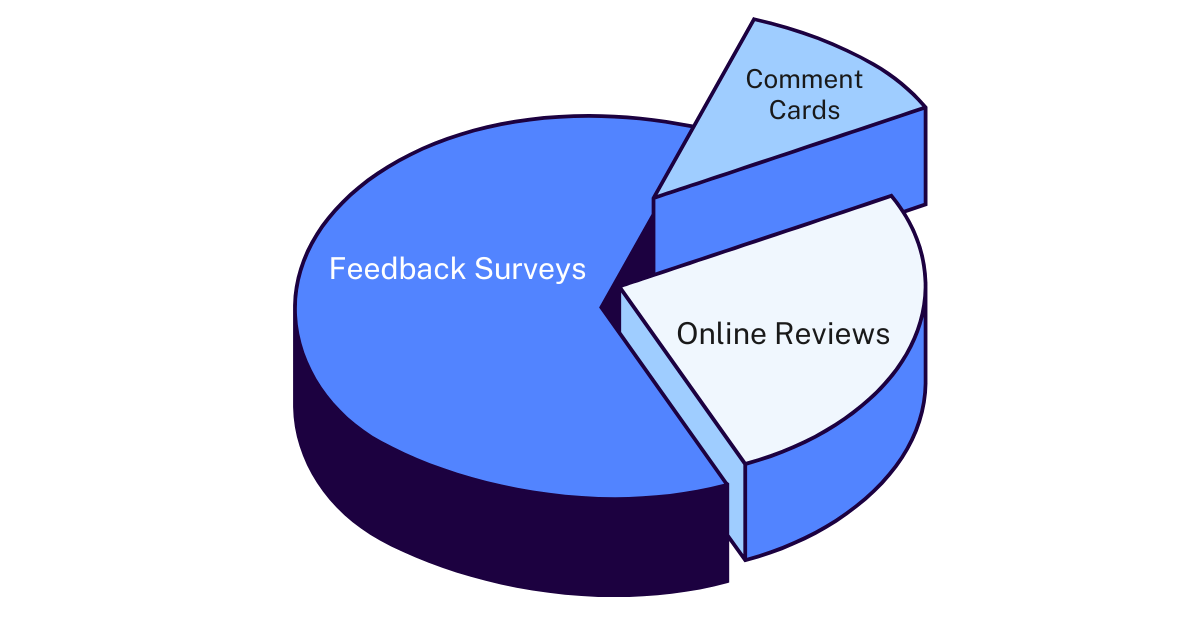
So, how do we keep up with it then? To make sure you're using the most up-to-date data, not just about preferences, but within your business as a whole, it's crucial that you adopt a proactive approach. Starting with surveys to get customer feedback is a great start. Comment cards, online surveys, or feedback forms are easy to implement and can get you on the right track for this. But it's also important that you keep up to date on the best practices when it comes to your selling tactics, offers, data tracking, and security/privacy. For example, Google Analytics 4 is completely taking over Universal Analytics for Google Analytics in July of 2023. If you miss the news on this and don't migrate before the transition, you'll be left with no data as the summer gets into full swing.
In addition to gathering feedback, stay attuned to industry trends and emerging consumer preferences by following industry reports, attending conferences, and engaging with local business groups. By doing so, you'll be better equipped to adapt your services or products to meet the changing demands, rather than needing to react to a downturn in business because of it.
Finally, when it comes to tracking your own business, we already mentioned the changes to Google Analytics above. However, your customer preferences can also be discovered through analyzing your own data. For example, are certain pages on your website getting a lot more traffic now, relative to the same period last year? Also identify seasonal trends, either in your data or based on what you know about your industry. This will allow you to be better prepared for periods in the year where business may be a little slower, and get creative to potentially cover some of the lost revenue in these months. Regularly monitoring your internal business data will help you see insights that may be too hard to see in the day-to-day operations of your business.
By embracing this approach and even only some of these strategies, you'll be better equipped to navigate the challenges of an ever-evolving business environment.
Mistake 4: Chasing Mirages with Vanity Metrics
Relying solely on vanity metrics, or even giving them significant weight in your analysis can create a false sense of success and obscure the true performance of your marketing efforts. These vanity metrics are things like page views, social media followers/likes, and anything else that lacks actionable substance. These superficial metrics can make you feel good, and think that things will begin to improve. But they lack the depth required to drive decisions and often just serve to distract your business.
Instead, you need to dig a little deeper to get a more accurate understanding of your marketing performance and uncover valuable insights. These actionable insights are necessarily better-defined, and attached to something that provides guidance on steps to take. These actionable metrics are created with a business goal or objective in mind, and measured intentionally to get the most value for your specific purpose.
There is a lot of detail that will be left for another article. But by shifting your focus from vanity metrics to metrics that are tracked intentionally and backed by an objective, you'll begin taking the proper steps toward having a data-driven business. These insights will help you get a clearer understanding of the effectiveness of, for example, your marketing campaigns and help you refine them based on the proper data. To illustrate this point a little more deeply, it's easy to imagine running two ads. One of them is a really low CPM (cost per 1000 impressions), and another that is quite a bit higher. Let's suppose the conversion rate is the same for both, and your objective is to get them to sign up for your email list. Looking at the vanity metrics alone, you may keep the lower CPM ad running and turn off the high CPM. However, digging deeper into the data, and properly tracking these people with tags and UTM parameters, would show you that maybe the higher CPM ad was producing 10x the return based on 30-day purchases of your service. Without digging deeper, and being distracted by the vanity metrics, you would've been turning off a wildly successful ad campaign.
As you navigate the challenges of data-driven decision making, remember to focus on the most relevant data points, establish specific objectives, and keep your data up to date. By doing so, you'll be better equipped to evaluate your performance, learn from your mistakes, and implement data-driven solutions that lead to long-term success.
Putting it All Together
By sidestepping common analytics mistakes and adopting a data-driven mindset, your small business can unlock a treasure trove of insights to fuel growth. An effective analytics strategy can help you identify inefficiencies, uncover hidden opportunities, and streamline operations. In the long run, informed decision-making can lead to increased profitability and a competitive edge in the market.
Embark on your analytics journey with confidence, and watch your small business thrive by leveraging the power of data-driven decisions.